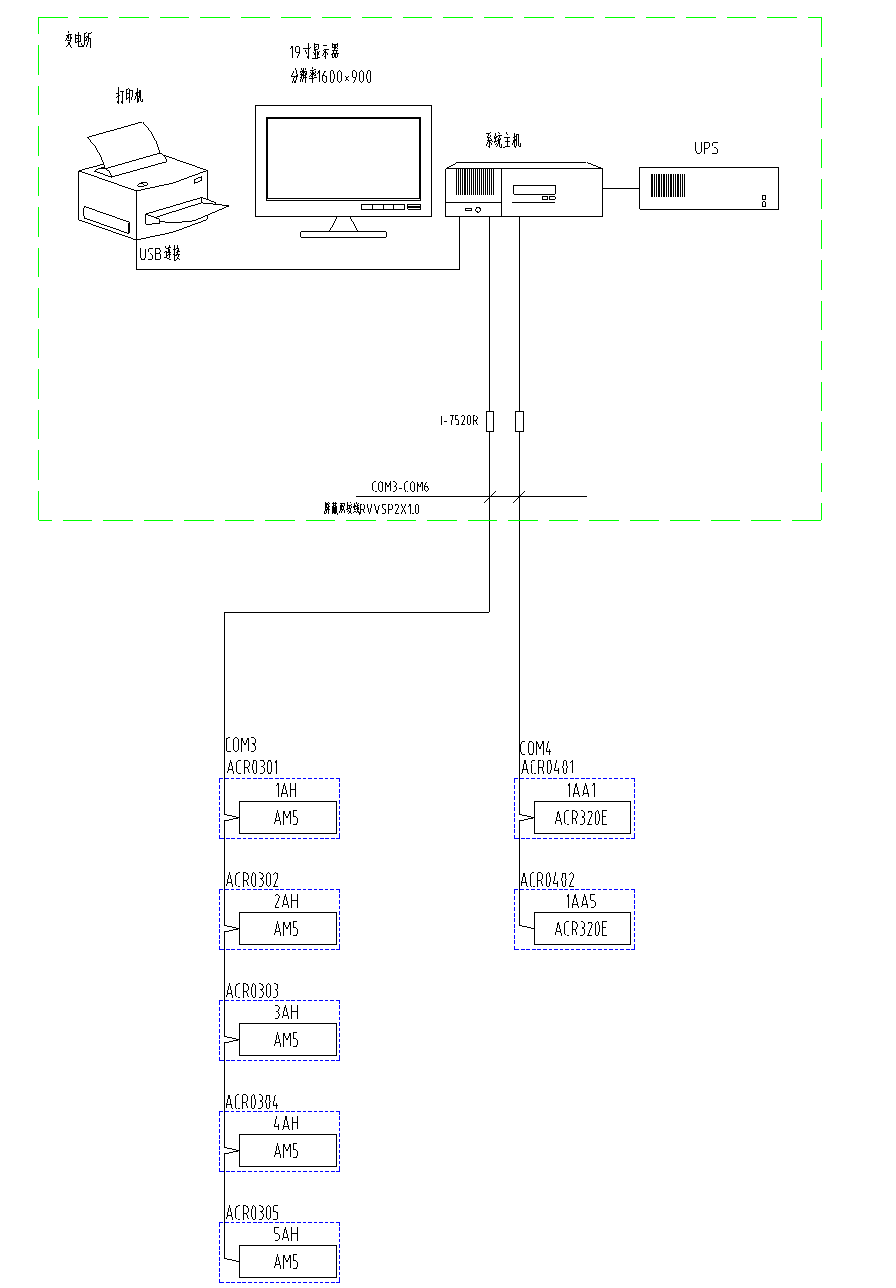
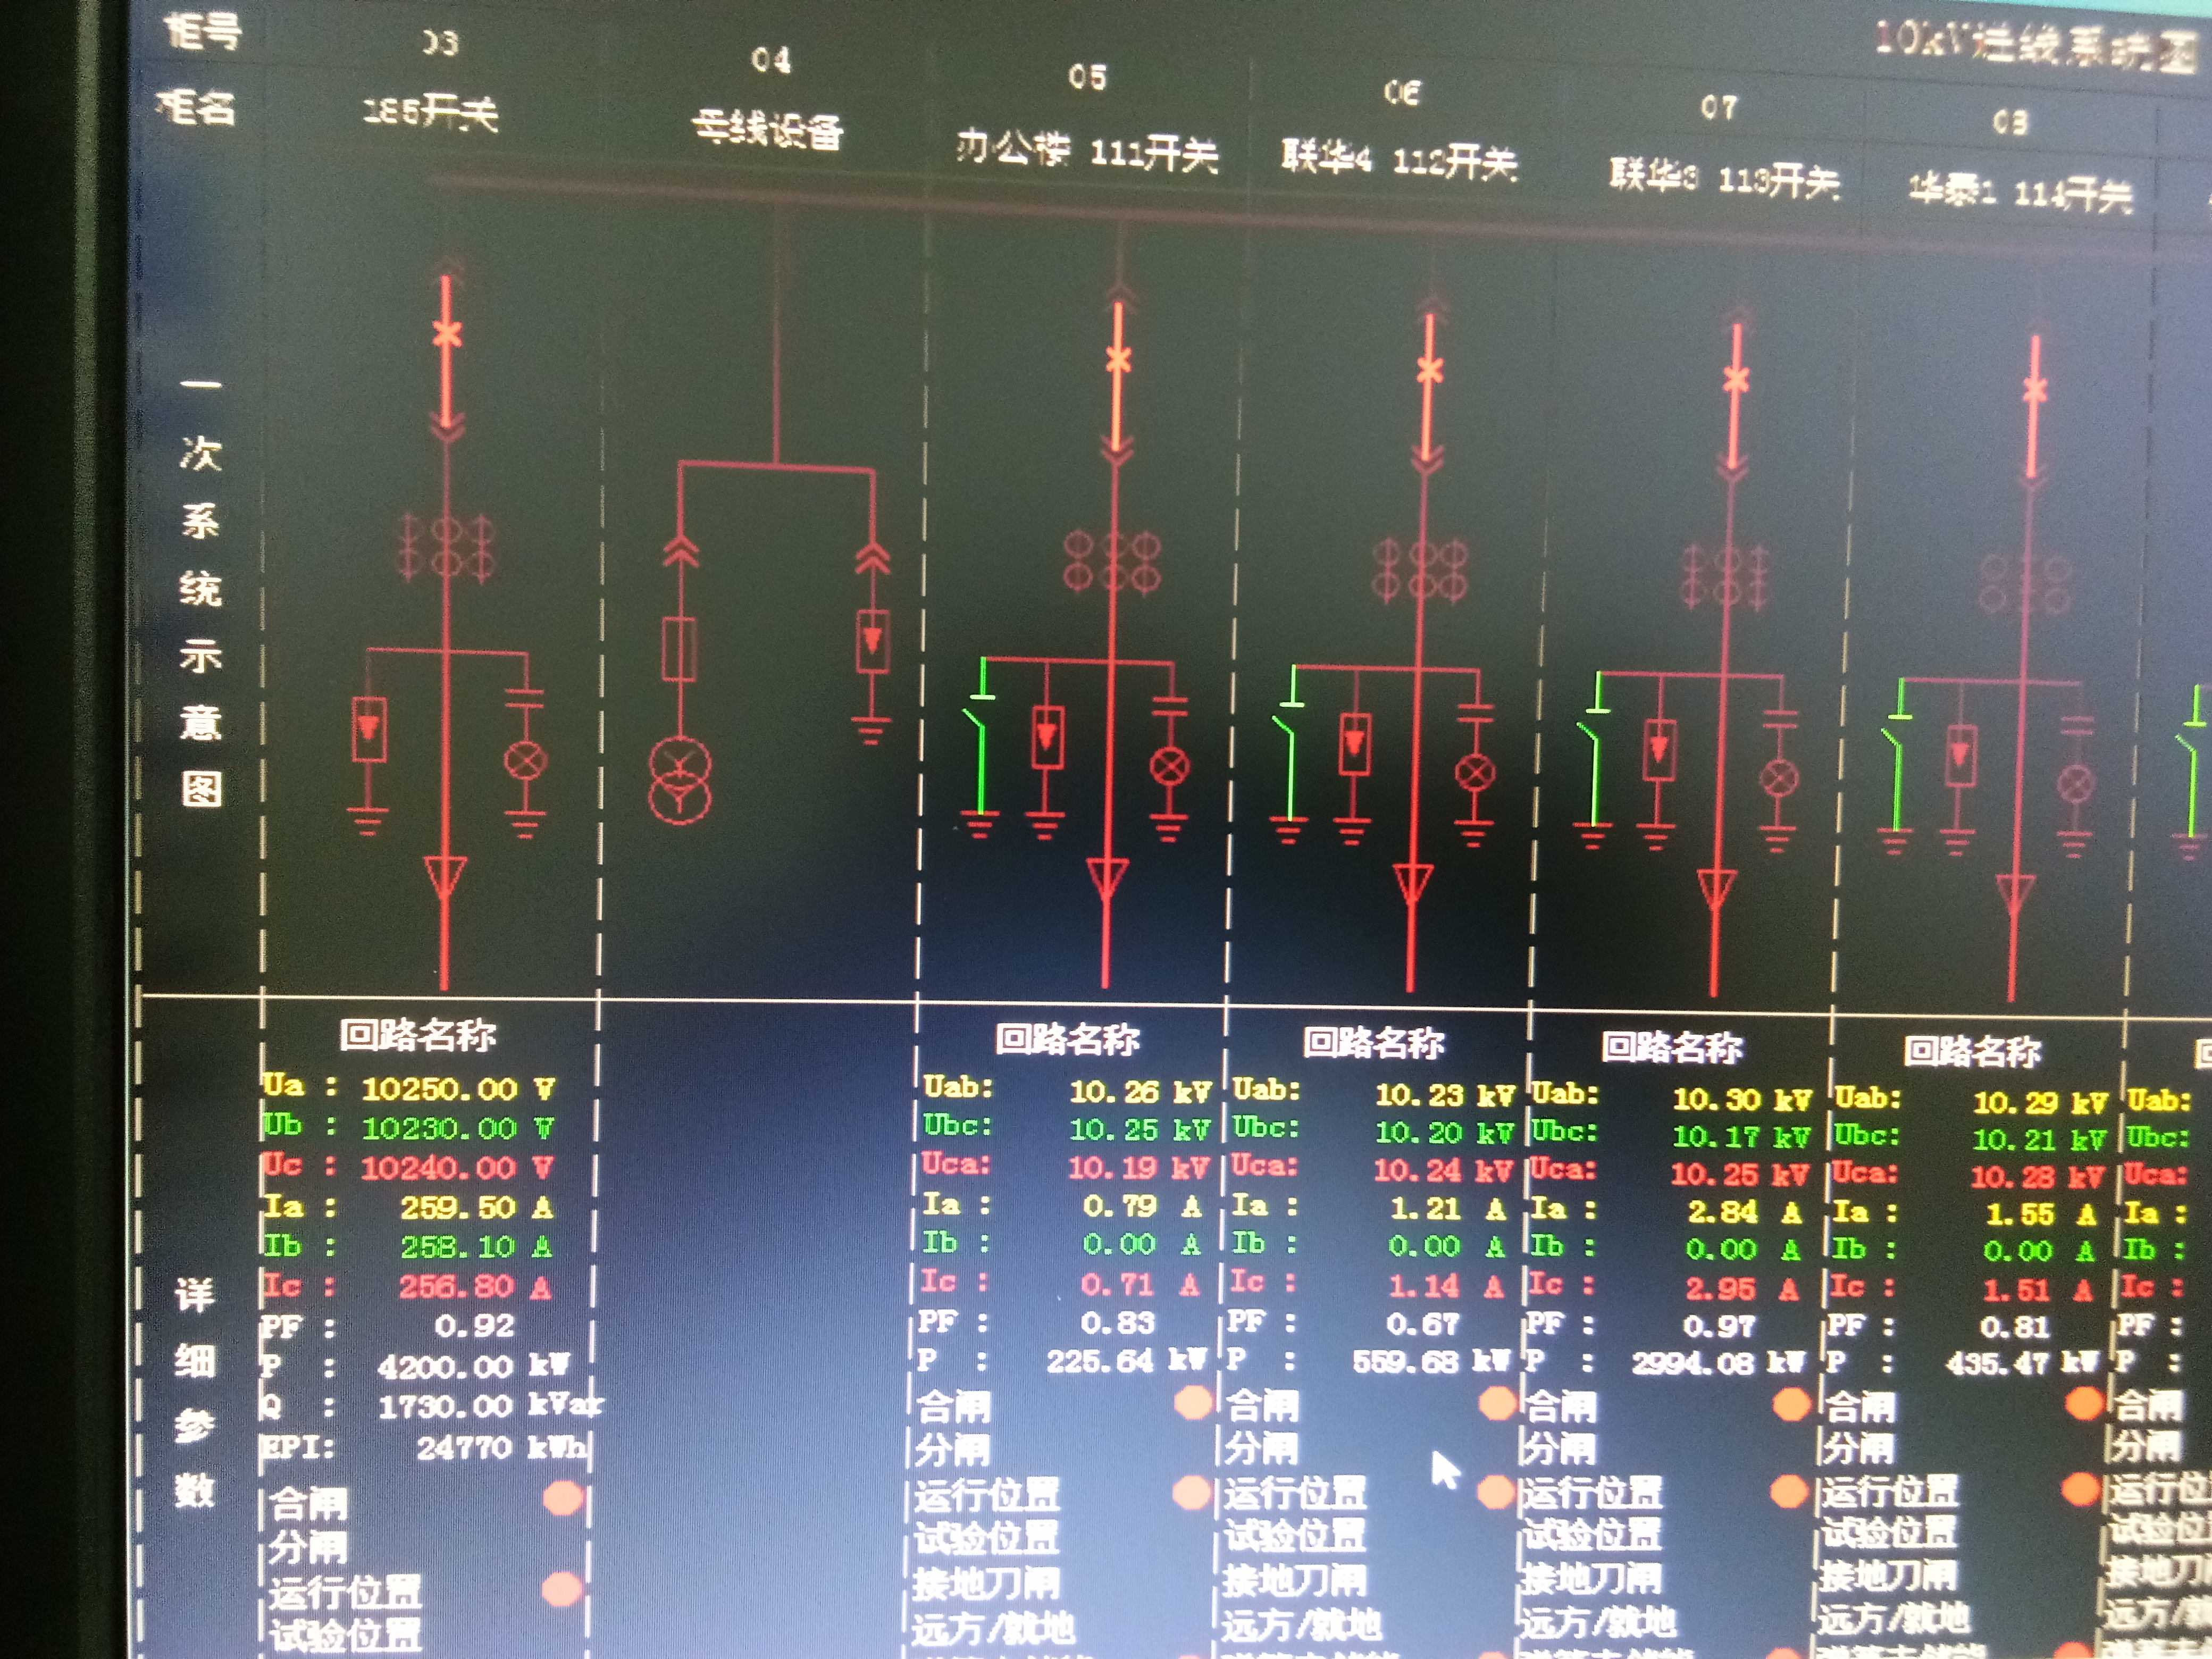
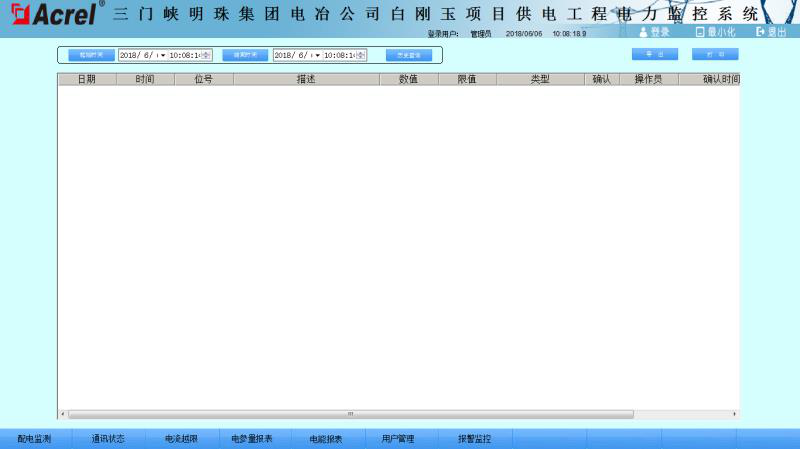
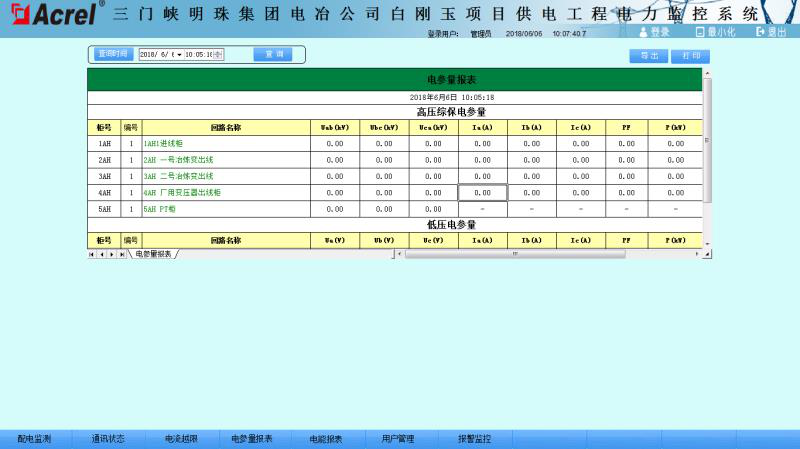
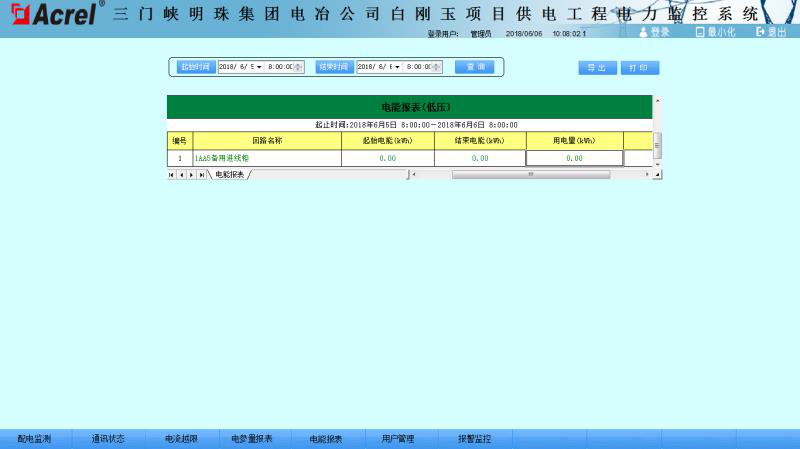
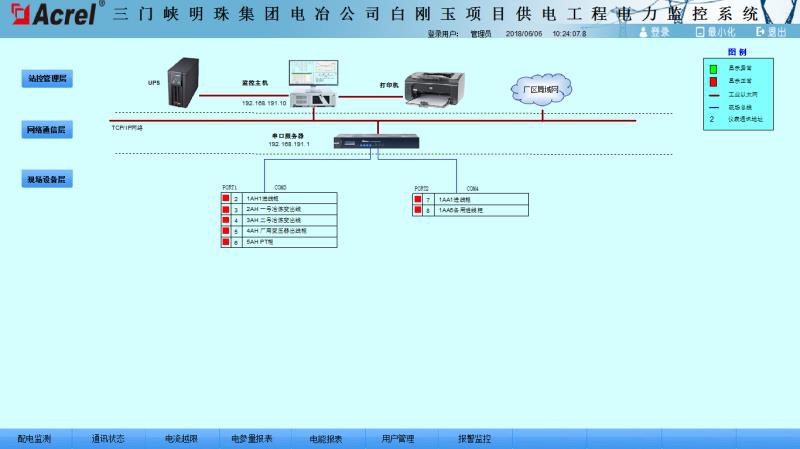
Abstract : This paper introduces the power monitoring system of Bai Gangyu project of Sanmenxia Mingzhu Group Electro-metallurgy Co., Ltd. and adopts intelligent power meter to collect various electrical parameters and switch signals at the distribution site. The system adopts on-site local networking method. After networking, it communicates via the field bus and transmits it to the background. The Acrel-2000 power monitoring system realizes real-time monitoring and power management of power distribution circuit substations. . Keywords: substation; smart power meter; Acrel-2000; power monitoring system 0 Overview This project is the electric power monitoring system of the Bai Gangyu project of the Sanmenxia Mingzhu Group Electric & Metallurgical Company. According to the requirements of power distribution system management, it is necessary to perform power monitoring on the power distribution room of Bai Gangyu project of Sanmenxia Mingzhu Group Electrical and Metallurgical Co., Ltd. to ensure the safety, reliability and high efficiency of electricity use. Acrel-2000 intelligent power distribution system makes full use of the development of modern electronic technology, computer technology, network technology and field bus technology, and conducts distributed data collection and centralized monitoring and management of the power distribution system. The secondary equipment of the distribution system is networked, and the distributed equipment of the distribution center is connected into an organic whole through the computer and communication network to realize the remote monitoring and centralized management of the power grid operation. 1 System Structure Description The monitoring system mainly implements electricity monitoring for the 10KV distribution system of Baigangyu project of Sanmenxia Mingzhu Group Electrical and Metallurgical Co., Ltd. The monitoring range covers 5 substations with high-voltage comprehensive protection and 2 low-voltage electric meters. The system has a total of 7 Ankerui meters, divided into 2 buses, and it is directly pulled to the computer in the duty room of the substation to achieve data connectivity between the instrument on the bus and the monitoring host. The monitoring system adopts a hierarchical distributed structure, namely station control layer, communication layer and bay layer; As shown in Figure 1: Figure (1) Network topology Interval device layer is mainly: multi-function network power meter. These devices are corresponding to the corresponding primary equipment installed in the electrical cabinet, these devices are used RS485 communication interface, through the on-site MODBUS bus network communication, data acquisition on the spot. The main network communication layer is: serial port conversion isolator. Its main function is to collect the scattered data at the site collection device, and transmit it to the station control layer at the same time to complete the data exchange between the field layer and the station control layer. Station control management: equipped with high-performance industrial computers, monitors, UPS power supplies, printers and other equipment. The monitoring system is installed on the computer to collect and display the operating status of the field equipment and display it to the user in the form of human-computer interaction. The above network instruments all use RS485 interface and MODBUS- RTU communication protocol. RS485 adopts shielded wire transmission. Generally, two wires are used for connection. The connection is simple and convenient. The communication interface is half-duplex communication, that is, both parties can receive and send data. Only data can be sent or received at the same time, and the data transmission rate is 10Mbps. The RS485 interface is a combination of balanced drivers and differential receivers. It has enhanced noise immunity and allows up to 30 devices to be connected on the bus. The maximum transmission distance is 500 meters. 2 main functions of the power monitoring system 2.1 Data Acquisition and Processing Data acquisition is the basis of power distribution monitoring. Data collection is mainly accomplished by the underlying multi-function network instrumentation, realizing local real-time display of remote data. The signals that need to be collected include: three-phase voltage U, three-phase current I, frequency Hz, power P, power factor COSφ, power Epi, and remote device operating status. The data processing mainly displays the electrical parameters collected according to requirements in real time and accurately to the user, so as to meet the requirements of automation and intelligence of the power distribution monitoring, and store the collected data in the database for user query. 2.2 Human-computer interaction The system provides simple, easy to use, and good user interface. Using the Chinese interface, the CAD graphic shows the electrical main wiring diagram of the high and low voltage distribution system, shows the status of the distribution system equipment and the corresponding real-time operating parameters, the screen timing switching tour; dynamic refresh of the screen real-time; analog display; switch display; Continuous record display and so on. 2.3 Historical events The historical event viewing interface provides convenient and friendly human-computer interaction for the user to view fault records, signal records, operation records, and over-limit records that have occurred. You can view the platform through historical events. You can easily locate your own according to your requirements and query conditions. The historical events that you want to view provide you with good software support for the overall system operation. 2.4 Database Establishment and Query It mainly completes the remote measurement and remote signal acquisition, and establishes a database to generate reports regularly for users to query and print. 2.5 User Rights Management For different levels of users, different permission groups are set to prevent the losses caused by human misoperation to production and life, and to realize the safe and reliable operation of the distribution system. You can use user management to perform user login, user logout, password change, and add/delete operations to facilitate user modification of accounts and permissions. 2.6 Remote Report Query The main function of the report management program is to design the report style according to the needs of the user, and the data processed in the system is filtered, combined and statistically generated to generate the report data required by the user. This program can also be based on the needs of users on the report file to save, print. At the same time, this program also provides users with management functions for generated report files. The report has the functions of freely setting the query time to realize daily, monthly, and annual energy statistics, data export, and report printing. 3 Case Studies Sanmenxia Pearl Group Electro-metallurgy Co., Ltd. White corundum project power supply engineering power monitoring system includes a substation, the project for this substation power distribution system for power management; substation high voltage distribution circuit for remote real-time monitoring. ACR320E multi-function meter is used in the circuit of the power distribution center. It is a network power meter designed for the power monitoring needs of power systems, industrial and mining enterprises, public facilities, and intelligent buildings. It can measure conventional power parameters such as three-phase voltage, Current, active power, reactive power, power factor, frequency, active power, reactive power and other electrical parameters. The series of network power meters are mainly used in substation automation, distribution network automation, residential power monitoring, industrial automation, energy management systems and intelligent buildings. High-voltage power distribution diagram shown in Figure (2), the function of the main power monitoring telemetry equipment operating parameters, including: line three-phase voltage, current, power, power factor, power, frequency and other electrical parameters and three out of the circuit Phase current; Remote signal function Realize the running status of the display field equipment, mainly including: switch's dividing, closing running status and communication failure alarm; When the circuit breaker is dislocated, it will send an alarm signal to remind the user to handle the fault in time. Figure (2) High-voltage distribution diagram The remote signaling and telemetry alarm functions mainly complete the monitoring of the switching operation status of the low-voltage outlet circuits and the incoming line monitoring of the load. The pop-up alarm interface is displayed for switch displacement and load over-limit, indicating the specific alarm position and sound alarm to remind the on-duty personnel to deal with it in time. With real-time query function, see Figure (3). Figure (3) Real-time remote alarm information The parameter reading function mainly inquires into the electrical parameters of the high voltage outlet circuits. Supports electrical parameter query at any time, with functions such as data export and report printing. This report queries the electrical parameters of each high-voltage loop for a substation, including: three-phase voltage, current, power factor, active power, and active power. The names of the loops in this report are associated with the database to facilitate the user to modify the loop name. See Figure (4). Figure (4) Parameter reading The electricity consumption report function can select the time period to inquire, supports the accumulated electricity inquiry at any time, and has the functions of data export and report printing. Provide accurate and reliable power report for duty personnel. The names of the loops in this report are associated with the database to facilitate the user to modify the loop name. As shown in the figure below, the precise power consumption of each distribution circuit in a certain period of time can be displayed. The user can directly print the report and can save it in EXCEL format to another location. See Figure (5). Figure (5) Energy Report The schematic diagram of the system communication structure mainly shows the networking structure of the system. The system adopts a hierarchical distributed structure and simultaneously monitors the communication status of the equipment at the bay level. Red indicates normal communication and green indicates communication failure. See Figure (6). Figure (6) System Communication Structure 4 Conclusion With the development of society and the widespread use of electricity, the power monitoring system has become an inevitable choice for users of substations in key projects, landmark buildings, and large-scale public facilities throughout the country. The Acrel-2000 power monitoring system introduced in this article is the Pearl of Sanmenxia. The application of the 10KV power distribution room of the Baigangyu project of the Group's Electrical and Metallurgical Company can realize the real-time monitoring and power management of the substation high and low voltage distribution circuits. It can not only show the power status of the circuit, but also has network communication functions. Serial Isolators, computers, etc. constitute an energy management system. The system analyzes and processes the collected data, displays the operating status of each distribution circuit in the substation in real time, and generates various energy reports, analysis curves, and graphs, which facilitates remote meter reading and analysis and research of electric energy. The system is safe, reliable and stable. It provides real and reliable basis for users of substations to solve electricity problems and has achieved good social benefits. [2]
SF factory is focus on quality and company's image. We win market with good quality and service. The company has already passed International Quality Management System ISO9001:2008 certification for many years and also got the CE certificate, smoothly got the title of High and New Tech Enterprises.
And has more than ten own intellectual property rights and patent technology. We have own import and export right. Our products exported to Russia, South Asia, South east Asia, Middle East, South America, Africa, Australia, Eastern Europe etc.
CNC Professional machine for Steel coil.
Products Mainly including:
Steel coil recoiler.
Steel coil uncoiler;
Steel coil uncoiler and shearing machine
Steel coil uncoiler and Slitting Machine;
Plate Drilling Mchine;
Shandong SF CNC Machinery Co., Ltd. is a grand manufacturer of
Transmission tower machines in china. With 23 years` experience in this line, we are committed to
producing only the finest products to our customers.
In 2019, we appointed Jinan JUFU International
Co.,ltd to specially export our machines to abroad markets. And now we have a
special engineer team for oversea market, and we are able to offer customer
timely service.
Steel Coil Cutting & Slitting Machine Steel Punch Machine,Steel Plate Machine,Steel Coil Slitter Machine,Steel Plate Drilling Machine Shandong ShuoFang Environmental Technology Co., Ltd. , https://www.chinafincnc.com